Any social output needs balance; in tone, form and frequency. Between us we have a vast and broad range of knowledge, yet individual expertise. We wanted a way to motivate our team to contribute to our social channels whilst retaining this balance.
We thought a bit of healthy competition, with a modest prize for the best contributors, could be a great way to drive engagement with everyone. We had an idea, but not the solution.
We looked at the existing (and potential alternative) tools we use for scheduling and analysing our social output to see if they would fulfil our needs. Surprisingly nothing did. Some did bits of what we wanted, but we would have had to jump through hoops to tie them all together.
So we set about building our own Social Media Dashboard which could interface neatly with Hootsuite and Trello, which we already use for social content scheduling. What’s resulted is a user-friendly suite which has led to an uptake in both quality and quantity of output.
With our social media dashboard integrated into our workflows:
- multiple contributors can submit content
- the comms team can approve the content before it’s published
- content can be scheduled and posted to our social channels
- content can be assigned to the contributor
Through the addition of a leaderboard we’ve stimulated some healthy competition where:
- posts can be scored based on engagement
- we can identify and reward creators of the best content over a defined period
We’ve instantly seen an increase in submissions but it hasn’t just been the dangling carrot of a monthly prize or the kudos, that’s driven engagement within the company. Being able to see at a glance which posts are getting the best scores helps us all refine our content, and over time the quality of material has also improved.
Quite simply, when engaged with your content positively, it encourages you to create more. And when a submission gains less traction, you can start to refine your output looking at those that were more successful for inspiration.
Overall, our output has increased in value. We’re not just seeing more likes, but more conversations forming.
The inner workings explained
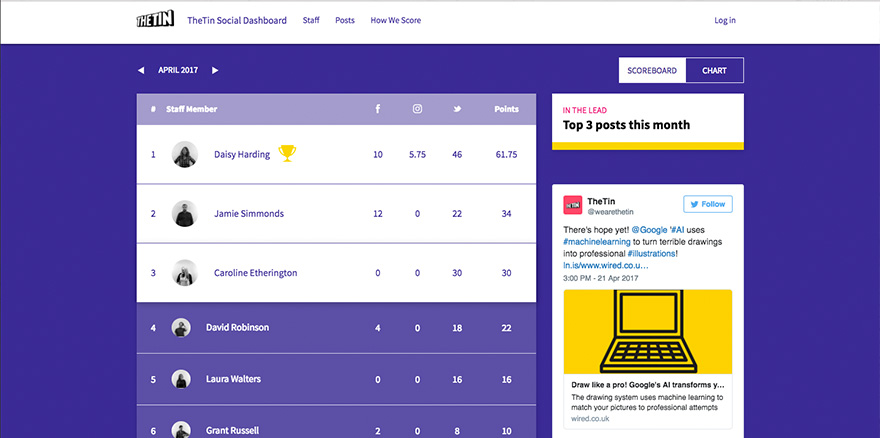
We knew we wanted a high score table, showing everyone’s cumulative score, but also something that showed more granular data for individuals, and their posts. As we had decided to run a competition on a monthly cycle a timeline seemed appropriate, but we weren't sure what to plot for each user. Should we focus on a user’s total score over time, or place more emphasis on the individual posts? To focus our thoughts, we looked at the social networks APIs, the level of detail they could provide, and their limitations.
The first big consideration with any API is rate limits; how often you can request data from the service. Our main channels are Twitter, Facebook, and Instagram. Each have similar interactions (though with different names); likes, shares and comments. We knew we could get the counts of each of these back, and in most cases a unique identifier of the person who had interacted. But this would take multiple calls to each API to do so, first getting the list of our latest posts, then getting detailed information on each.
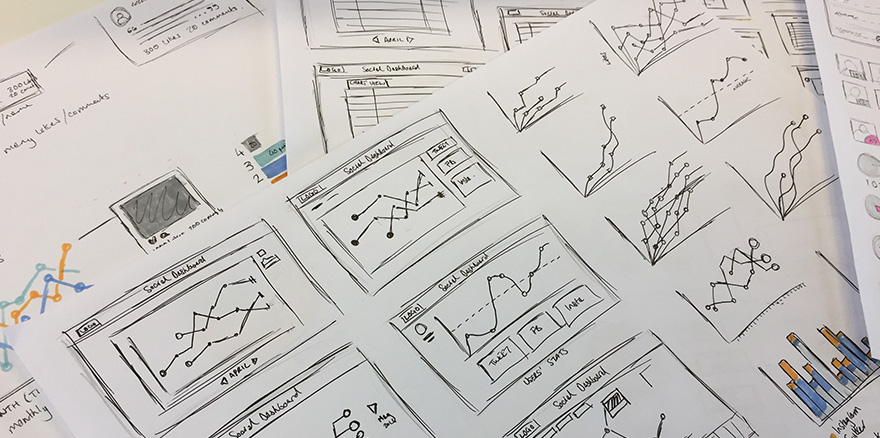
Whilst ideally, we would poll every minute to get highly granular data on interactions, this was not going to be possible. Having to make multiple queries each time, realistically we were only going to get data in 15 minute intervals. It would be great to see detailed information, including every interaction at the time it was made, but it wasn’t really going to be feasible. Working within this limitation, after much debate, sketching ideas on paper, and test plotting real data with charting components, we settled on a solution. To show the cumulative score of individual posts, assigned to a user, on the date they were posted.
This would give us a way to easily see the best posts, when they were posted, by whom, and the social network on which they were posted.
Now that we had our outputs we set to work gathering the data. Service helpers were written for each API, making all the calls needed to pull in the posts, and the IDs of those who had interacted, storing them in a database. Knowing these IDs also allowed us to eliminate ourselves from the scores, we didn’t want people to be dissuaded from sharing the company's output for fear of giving each other points!
At the same time, we built several admin interfaces. One area allows us to setup the team. Another section lists all the posts from each social network, with a simple dropdown for assigning them to the contributor. We now had a way to score posts based on their interactions and align them to members of staff. The high score table was simple to build, and having recently used amCharts on a project it seemed an ideal fit. It wasn't long before we had a timeline showing all the posts based on the data. However, there was an issue.
Whilst some posts had relatively low scores, others were literally off the chart. Looking at the breakdowns it was obvious why. Different networks naturally have different levels of interaction, and different interactions require different levels of commitment or intent. A like on Instagram has a lot less friction than a comment on Facebook. We extended the system to allow us to assign a different value to each interaction, so (for example) a like on Instagram would only be worth 0.1 points, whilst a reply on Twitter would be worth 3. We also added the ability for an administrator to assign a multiplier to any posts, to further boost their scoring potential.
Once we were happy the system was stable, and balanced, we opened it up to the whole company and started the competition. The uptake was instant and positive, with submissions increasing almost overnight.
And then, in November we upped the ante. The company was already planning on taking some of the team out to SXSW, and we wanted the best social media commentators to go too, not just to share content externally, but to collate it to share back with the whole company. Over a 3-month period we would total the scores, with the top 3 contributors getting the golden tickets. This lead to another leap internally and once again, people were creating more and more high value content.
Six months on, the system has shown no decline in usage. Due to the modular nature, we can easily add more services, and are currently implementing LinkedIn, as well as continuously monitoring the scoring.
It’s been a great success within the company, and we want to help you too. If you think your company or agency could benefit from a Social Media Dashboard, then please contact [email protected] to discuss how it could work for you.
As your brand and technology partner, we’ll create unique brand experiences for your customers, working flexibly to deliver technology solutions that are right first time.
We can help build your brand through technology, email [email protected]